GameDay View is a reporting dashboard dedicated to providing high-level business intelligence and insights on your organisation's membership and transactional data.
Using high-level summary data and visual insights, GameDay View is designed to give you a quick, yet powerful snapshot of certain metrics within your data set in a format that is perfect for presentations or board reports, and gives you a great overview of the helath of your sport.
Note: GameDay View is currently not available to all customers. If you do not have access to GameDay View within your GameDay database, please contact GameDay directly through the enquiry form here.
Accessing GameDay View
To access GameDay View:
1. Click GAMEDAY VIEW in the left-hand menu.
Current reports available in GameDay View include:
KPI Summary
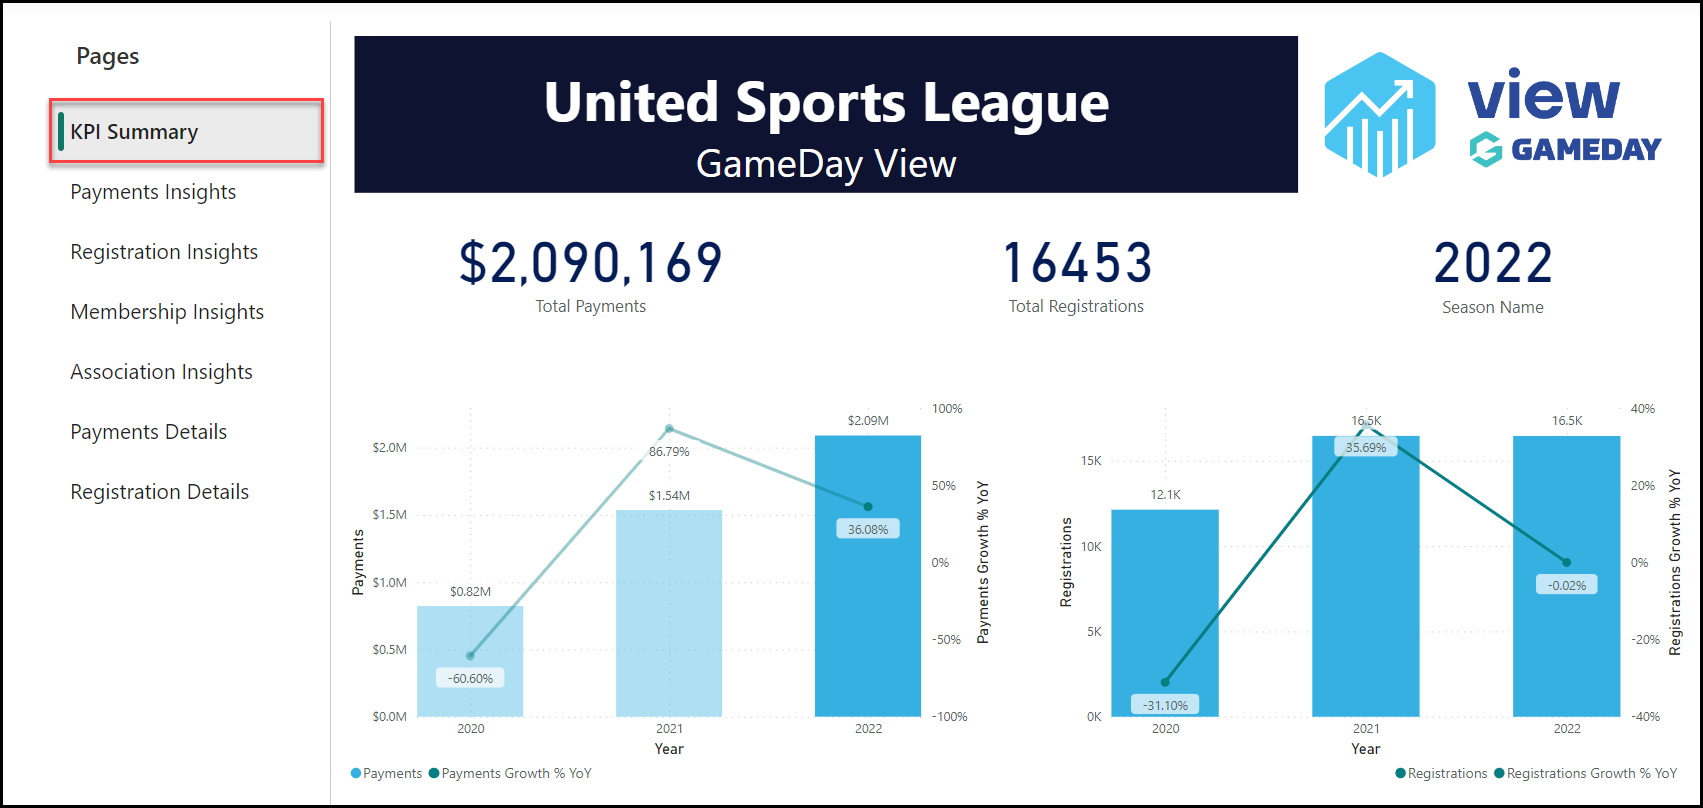
The KPI Summary dashboard displays:
- Total Payments: The total value of all payments processed in your GameDay hierarchy. This figure updates automatically to reflect the applicable season when clicking on any of the bars in the dashboard.
- Total Registrations: The total number of registrations processed in your GameDay database. This figure updates automatically to reflect the applicable season when clicking on any of the bars in the dashboard.
- Season Name: Indicates which season the dashboard metrics are calculating. Updates automatically to reflect the applicable season when clicking on any of the bars in the dashboard.
- Total Payments and Registrations by Year: The two bar charts shown on this dashboard give you a year-on-year breakdown of the total payments (in the left-hand chart) and total registrations (in the right-hand chart), including a trend line showing the year-on-year growth for payments and registrations each year.
Payment Insights
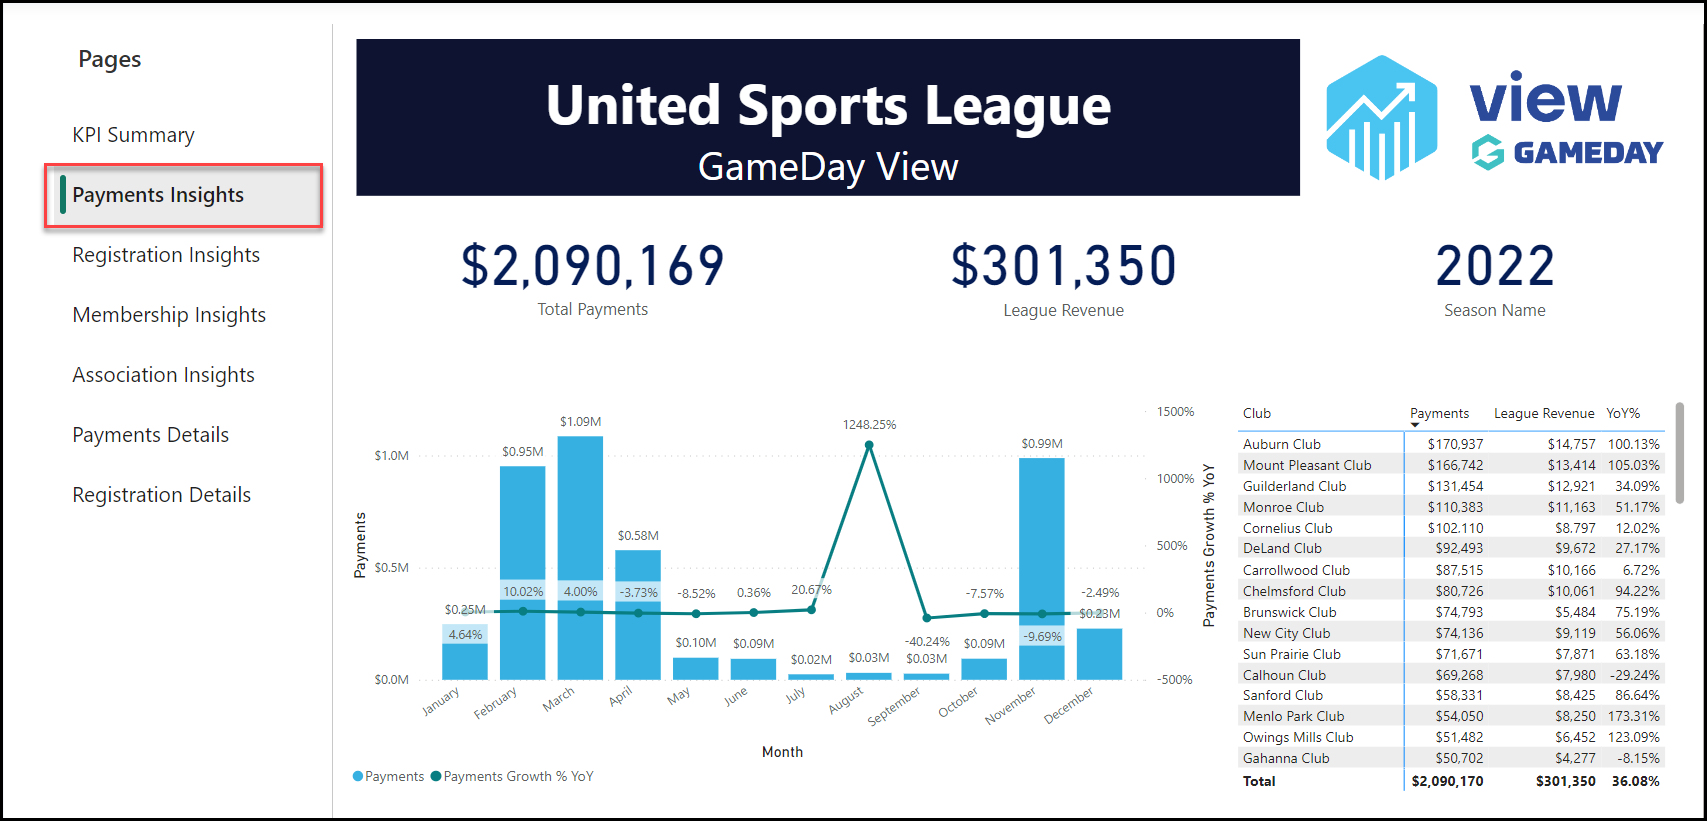
The Payment Insights dashboard displays:
- Total Payments: The total value of all payments processed in your GameDay hierarchy. This figure updates automatically to reflect the applicable season when clicking on any of the bars in the dashboard.
- League Revenue: The total revenue collected from payments into your individual GameDay database. This figure updates automatically to reflect the applicable season when clicking on any of the bars in the dashboard.
- Season Name: Indicates which season the dashboard metrics are calculating. Updates automatically to reflect the applicable season when clicking on any of the bars in the dashboard.
- Total Payments by Month: The bar chart shown on this dashboard displays a breakdown of total payments processed in your GameDay database by month, including a trend line showing the year-on-year payment growth for each month.
- Payments by Organisation: Displays a list of all organisations within your hierarchy, including their total payments processed, league revenue and year-on-year growth percentage.
Registration Insights
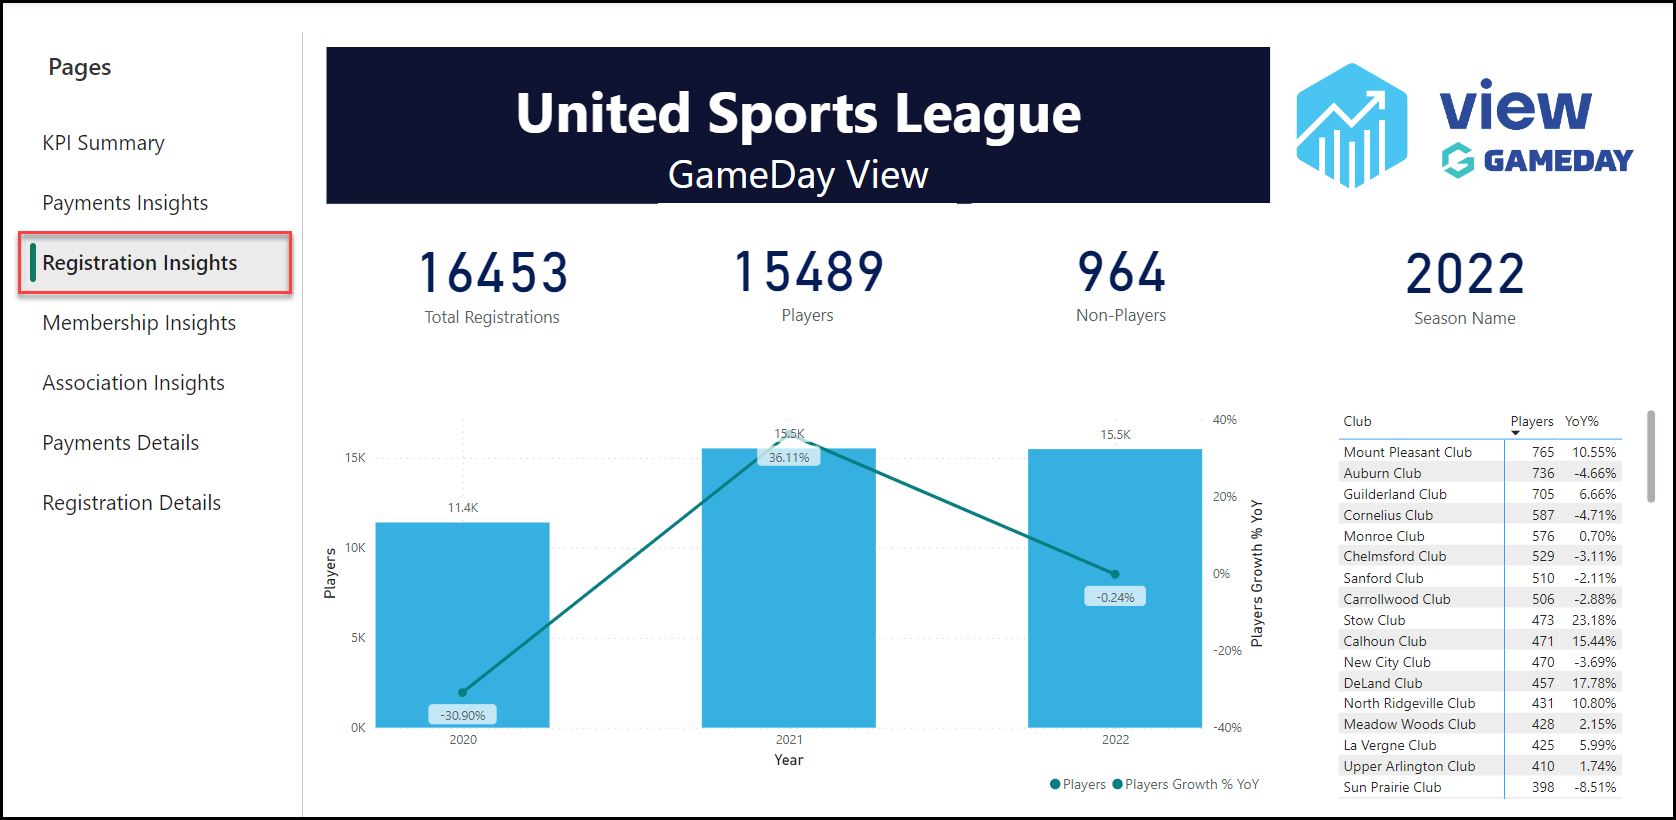
The Registration Insights dashboard displays:
- Total Registrations: The total number of registrations processed in your GameDay hierarchy. This figure updates automatically to reflect the applicable season when clicking on any of the bars in the dashboard.
- Total Players: The total number of player registrations processed in your GameDay hierarchy. This figure updates automatically to reflect the applicable season when clicking on any of the bars in the dashboard.
- Total Non-Players: The total number of non-player registrations processed in your GameDay hierarchy. This figure updates automatically to reflect the applicable season when clicking on any of the bars in the dashboard.
- Season Name: Indicates which season the dashboard metrics are calculating. Updates automatically to reflect the applicable season when clicking on any of the bars in the dashboard.
- Total Players by Year: The bar chart shown on this dashboard gives you a year-on-year breakdown of the total players registered to your organisation, including a trend line showing the year-on-year growth for registered players.
- Players by Organisation: Displays a list of all organisations within your hierarchy, including their total player registrations processed for the current season and year-on-year growth percentage.
Membership Insights
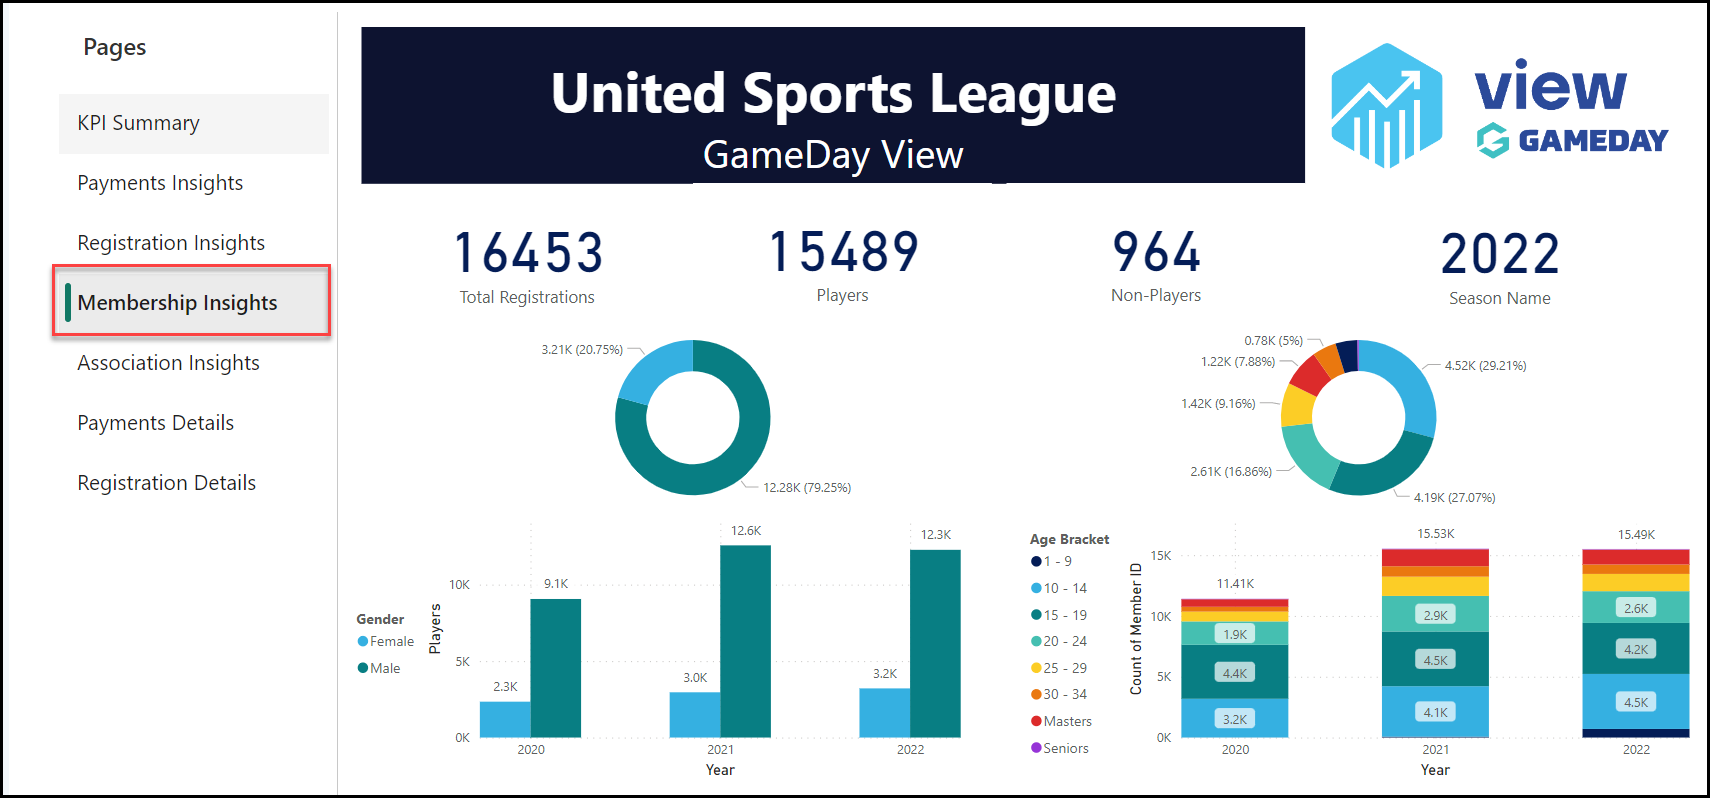
The Membership Insights dashboard displays:
- Total Registrations: The total number of registrations processed in your GameDay hierarchy. This figure updates automatically to reflect the applicable season when clicking on any of the bars in the dashboard.
- Total Players: The total number of player registrations processed in your GameDay hierarchy. This figure updates automatically to reflect the applicable season when clicking on any of the bars in the dashboard.
- Total Non-Players: The total number of non-player registrations processed in your GameDay hierarchy. This figure updates automatically to reflect the applicable season when clicking on any of the bars in the dashboard.
- Season Name: Indicates which season the dashboard metrics are calculating. Updates automatically to reflect the applicable season when clicking on any of the bars in the dashboard.
- Gender Breakdown: The Pie Chart and Bar Charts shown on the left-hand side of the dashboard displays a breakdown of total registrations for the current year by Gender.
- Gender Breakdown: The Pie Chart and Bar Charts shown on the right-hand side of the dashboard displays a breakdown of total registrations for the current year by Age Bracket.
Association Insights
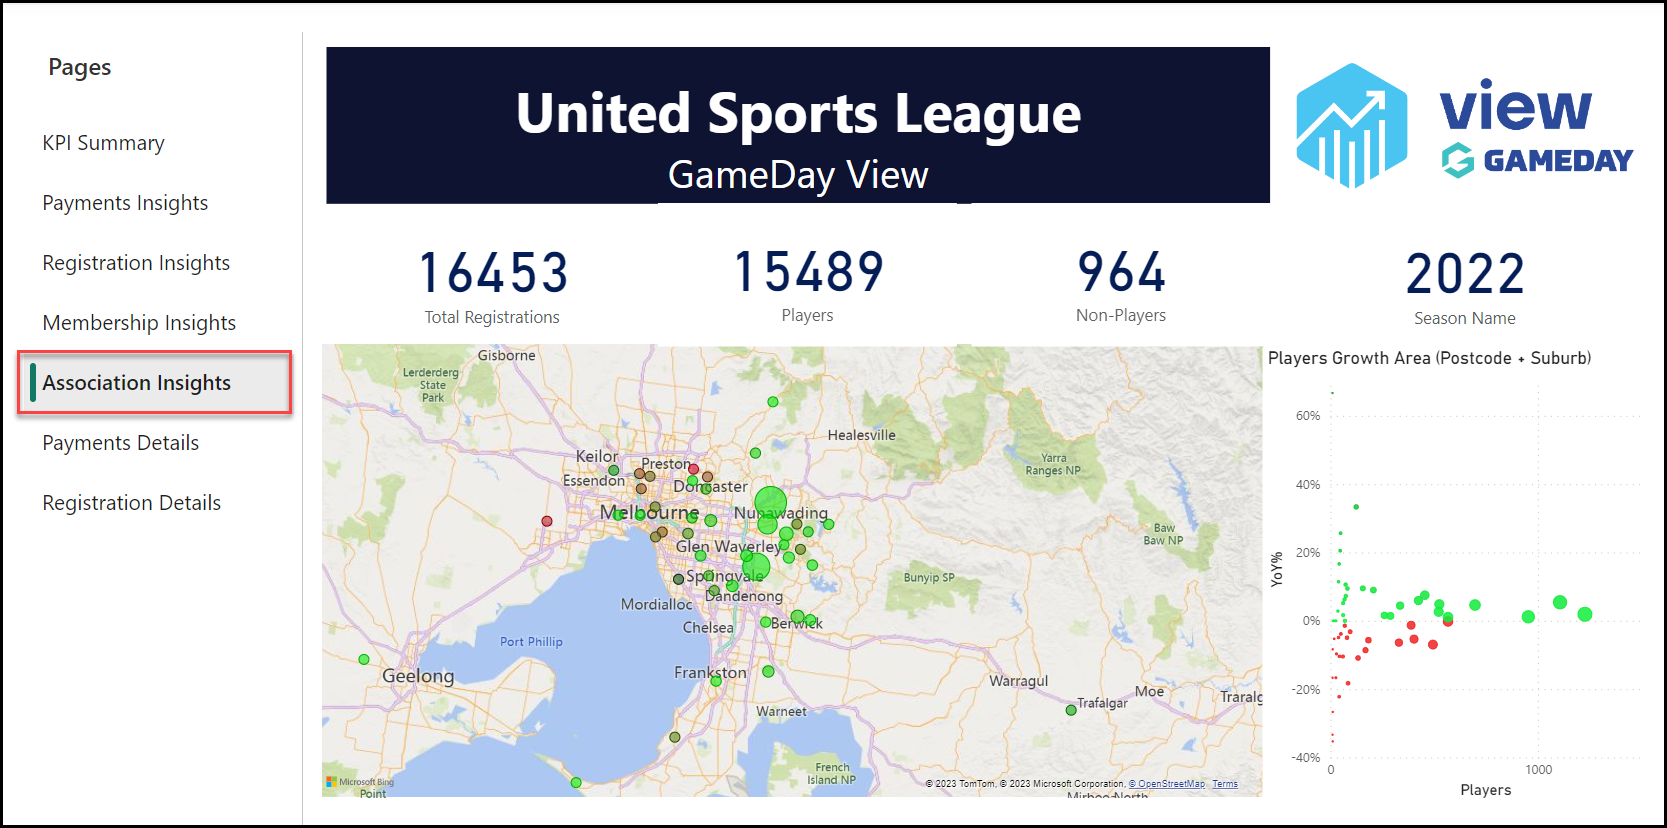
The Association Insights dashboard displays:
- Total Registrations: The total number of registrations processed in your GameDay hierarchy. This figure updates automatically to reflect the applicable season when clicking on any of the bars in the dashboard.
- Total Players: The total number of player registrations processed in your GameDay hierarchy. This figure updates automatically to reflect the applicable season when clicking on any of the bars in the dashboard.
- Total Non-Players: The total number of non-player registrations processed in your GameDay hierarchy. This figure updates automatically to reflect the applicable season when clicking on any of the bars in the dashboard.
- Season Name: Indicates which season the dashboard metrics are calculating. Updates automatically to reflect the applicable season when clicking on any of the bars in the dashboard.
- Association Map: An interactive hotspot map showing the top Associations (by player volume) for your hierarchy.
- Associations Growth: A plotted chart showing the Association hotspots by total players and year-on-year growth.
Payment Details
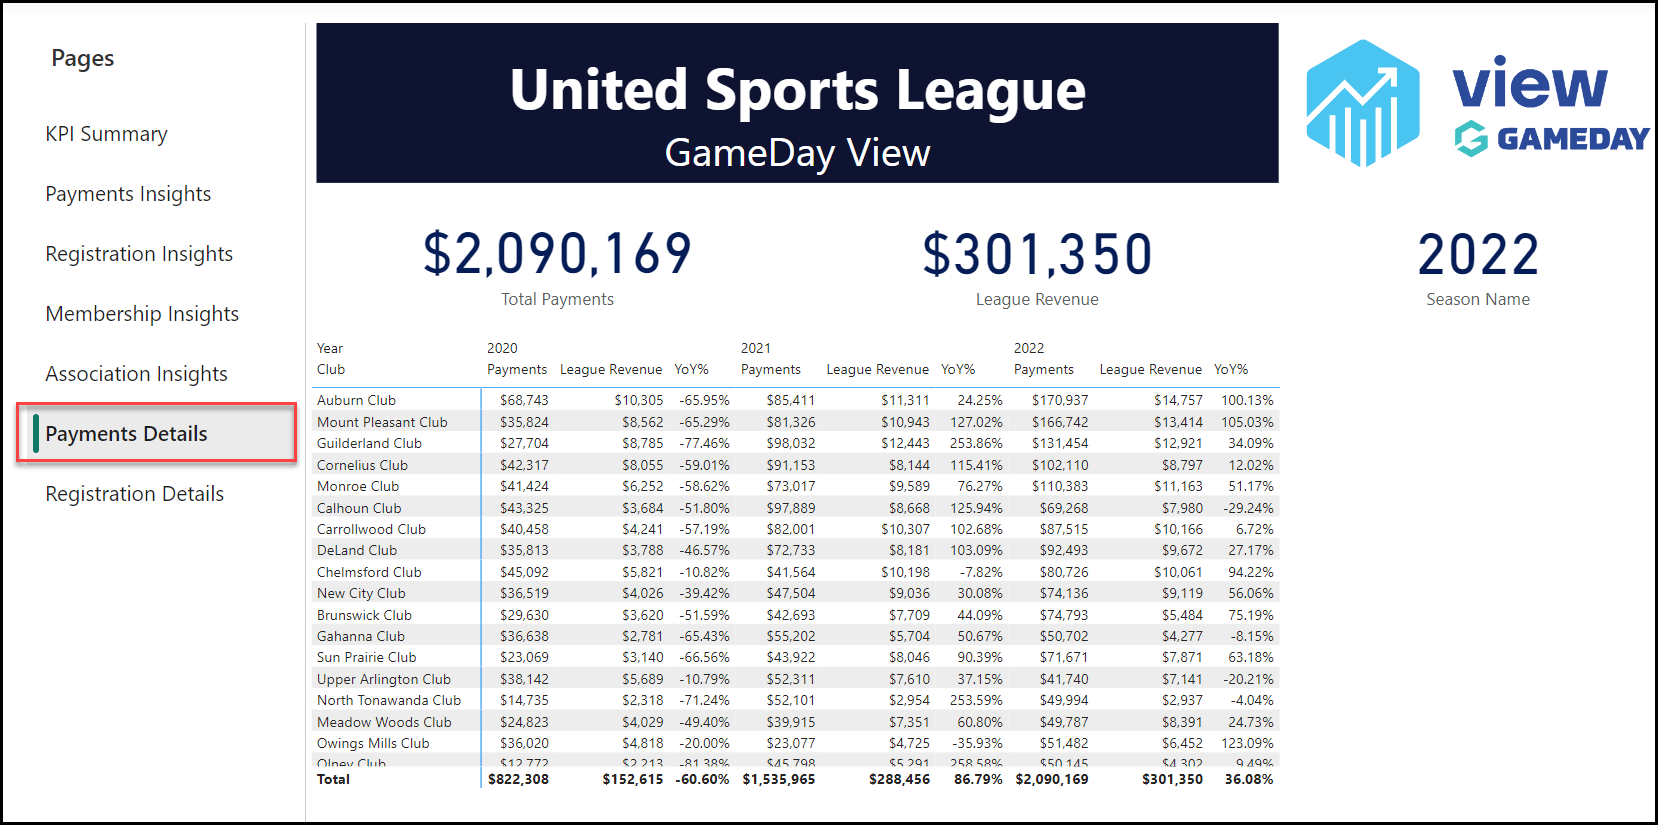
The Payments Details dashboard displays:
- Total Payments: The total value of all payments processed in your GameDay hierarchy. This figure updates automatically to reflect the applicable season when clicking on any of the bars in the dashboard.
- League Revenue: The total revenue collected from payments into your individual GameDay database. This figure updates automatically to reflect the applicable season when clicking on any of the bars in the dashboard.
- Season Name: Indicates which season the dashboard metrics are calculating. Updates automatically to reflect the applicable season when clicking on any of the bars in the dashboard.
- Payments by Organisation: A table-based breakdown of each organisation in your hierarchy including payments, league revenue and year-on-year growth per year.
Registration Details
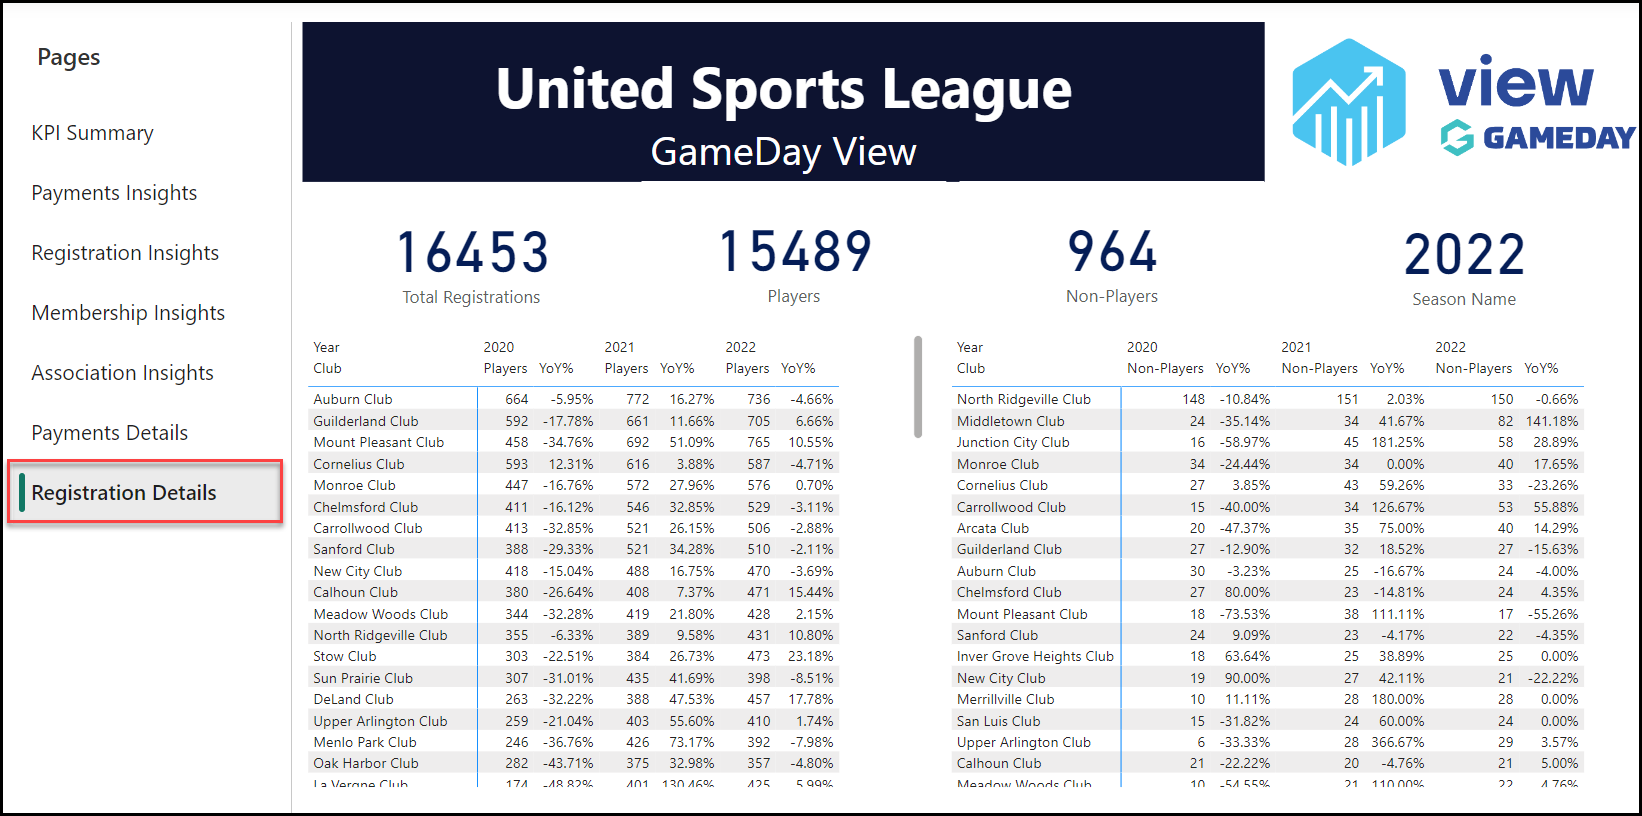
The Registration Details dashboard displays:
- Total Registrations: The total number of registrations processed in your GameDay hierarchy. This figure updates automatically to reflect the applicable season when clicking on any of the bars in the dashboard.
- Total Players: The total number of player registrations processed in your GameDay hierarchy. This figure updates automatically to reflect the applicable season when clicking on any of the bars in the dashboard.
- Total Non-Players: The total number of non-player registrations processed in your GameDay hierarchy. This figure updates automatically to reflect the applicable season when clicking on any of the bars in the dashboard.
- Season Name: Indicates which season the dashboard metrics are calculating. Updates automatically to reflect the applicable season when clicking on any of the bars in the dashboard.
- Players by Organisation Breakdown: A table-based breakdown of each organisation in your hierarchy including total players and year-on-year growth per year.
- Non-Players by Organisation Breakdown: A table-based breakdown of each organisation in your hierarchy including total non-players and year-on-year growth per year.